Introduction to Polygraphs
In my last blog, I talked about how we developed requirements for a Cloud Workload Protection Platform (CWPP) for modern data centers. In this blog, I’m going to dive into the heart of the matter: how Lacework builds the baseline we use for everything from breach detection to incident investigations. But first, let me recap two of the fundamental characteristics any CWPP should have:
- A CWPP must be comprehensive – every cloud entity and its activity has to be monitored. We can’t leave any dark corners for attackers to hide i.e. No sampling.
- The CWPP must be ‘no rules, no policies, no logs’. In the real world, the volume of information needed to meet criteria #1 is staggering. Zero-touch is the only way to make it happen.
Before I get started, I’d like to set the stage by looking at what life is like in a typical modern data center.
Like all well-designed IT solutions, modern data centers are designed for failover, data recovery, performance and availability. Workloads are dynamic, elastic, and can run anywhere – VMs, containers, IaaS, or even old-school dedicated boxes. Administrators have adopted a few best practices to meet these demands:
- Service monitors watch VM health and automatically restart VMs should they die. New VMs may appear anywhere in the data center with new or recycled IP addresses.
- Applications automatically discover needed services and consume this capacity when it’s available. Service ports can change for applications as this happens.
- Capacity is also managed automatically, and VMs are auto-balanced as demand ebbs and flows.
- Periodic refresh cycles reduce unexpected server malfunctions but also add to the brisk rate of change in the data center.
- Software teams take advantage of Docker containers and orchestration tools (e.g. Mesos, Marathon, Kubernetes, Swarm) to be agile and fast.
- DevOps supports continuous integration activities that introduce new VMs even as old machines are terminated.
When you realize that these activities are happening in data centers that can average 10,000 virtual machines running hundreds of applications, you begin to understand the magnitude of the challenge. Any tool must handle the huge volume of normal changes and avoid the avalanche of false positives that render so many other tools useless.
Our answer? Lacework’s deep temporal baseline, which we present to users as a set of behavioral maps or “Polygraphs”. Given the complexity and volume of a modern data center, it’s fair to ask how we go about creating the baseline with zero-touch without leaving any blank spaces where attackers can hide.
First, we decompose the data center into the lowest possible isolation unit that an OS supports: a process. Everything that happens in a data center, happens through a process. Every app has a different process and processes are not mixed between apps. When it comes to baselining a complex data center, they are the ideal unit for us to watch:
- They can be validated – every process is associated with a specific binary that has a particular SHA-256 hash.
- They are traceable – processes are launched by users, applications, or other processes and we can keep track of how they started.
- They are predictable – a process has a particular command line, purpose, and a life cycle.
- They are responsible for all communications – processes, and only processes, communicate with each other and with external hosts on the Internet
The challenge, of course, is that there might be millions of processes at any given time, and they churn really fast. While we can certainly capture all the interesting bits about all the processes in play, it’s not realistic to expect an administrator to efficiently interact with that mountain of data.
We can, however, automatically make sense of them if we aggregate processes in a way that reflects the structure of the data center itself. Here’s a short illustration of one of Lacework’s process aggregation principles:
Imagine a connection made from one process to another in a data center. We are most interested in this connection’s behavior:
- Does the port matter on which the communication happened?
- What if one of the processes died and identical one serving the same app started?
- What if the application was relocated to another machine?
- Or the listening port changed as the machine migrated?
- What if both of these applications were new processes in a copy of the data center?
- Or if a failover kicked in and moved both to a new availability zone?
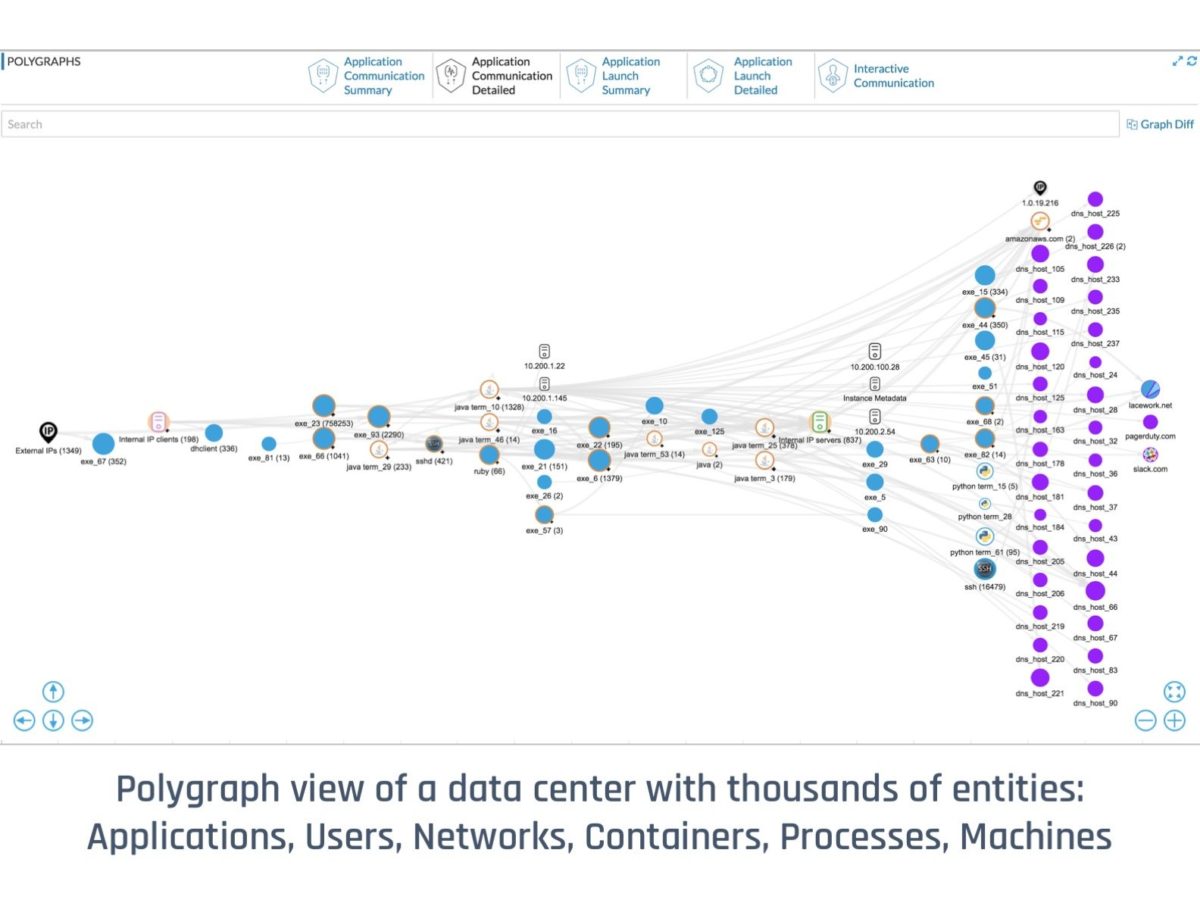
In all these cases is it still the same ‘communication behavior’? The answer is yes (that leads us to our solution), it IS the same communication behavior and none of the above changes matter. Logically: App A connected to an App B. We use this insight to dramatically simplify the information presented to users. Doing this for all million processes in our example data center gives us our first polygraph:

(The above graph is anonymized, so names are representative. Numbers in brackets designate a number of processes in the cluster.)
To recap, we build Lacework’s deep temporal baselines using two principles:
- We track processes because they are predictable, traceable, can be validated, and are responsible for all communications in the data center
- We focus on process behaviors to bring clarity to the graphs that represent the state of the data center
If you’re interested in getting a Polygraph for your own cloud-based data center (in AWS, Azure or on-premises), you can sign-up for our free trial at: https://posts.lacework.com/fr/free-trial/
Within two hours of Lacework being activated, you will get a logical view of all entities and their activities in your data center.


